
Did you know that technical analysis is a powerful tool that can refine your trading strategies, help you identify market trends, and make informed investment decisions in the forex market?
Technical analysis is a popular method used by traders to analyze price charts and patterns to determine the future direction of a market and potential entry and exit points for each position. By mastering technical analysis, you can gain a competitive edge in the forex trading world and increase your chances of success.
Key Takeaways:
- Technical analysis is a valuable tool in forex trading for refining strategies and making informed investment decisions.
- It involves analyzing price charts and patterns to determine market trends and potential entry and exit points.
- Technical analysis can be complemented with risk management, discipline, and the integration of fundamental analysis.
- By studying chart patterns and utilizing key indicators, traders can enhance their technical analysis skills.
- Mastering technical analysis can improve your chances of success in the forex market.
What is Technical Analysis?
Technical analysis is a method that relies on reading price charts to identify trading opportunities. Traders use these charts to determine the future direction of a market and to find potential entry and exit points for their positions. By analyzing historical price data and patterns, technical analysis aims to make predictions about future price movements. This approach provides traders with valuable insights into market trends and helps them make informed trading decisions.
Traders can view technical charts through trading platforms like MetaTrader or charting software provided by brokerage firms. These tools offer a wide range of features, allowing traders to analyze price charts, identify trading opportunities, and track market trends. By utilizing technical analysis, traders can navigate the complex world of trading and optimize their strategies to capitalize on trading opportunities.
Understanding Technical Analysis is crucial for identifying trading opportunities.
Benefits and Drawbacks of Technical Analysis
Technical analysis is a valuable tool in forex trading, offering several benefits as well as drawbacks to consider. Understanding these can help traders make informed decisions and refine their trading strategies.
The Benefits of Technical Analysis
Technical analysis serves as a neutral trading tool, as it can be applied to any instrument and timeframe without relying on an analyst’s forecast. This flexibility enables traders to determine their entry and exit points for each position, allowing them to push their profits further. By studying price charts and historical data, traders can identify patterns and trends that indicate potential price movements, empowering them to make well-informed trading decisions.
“Technical analysis provides traders with the advantage of determining their entry and exit points through the analysis of price charts and historical data. This helps optimize trading strategies and maximize profits.”
The Drawbacks of Technical Analysis
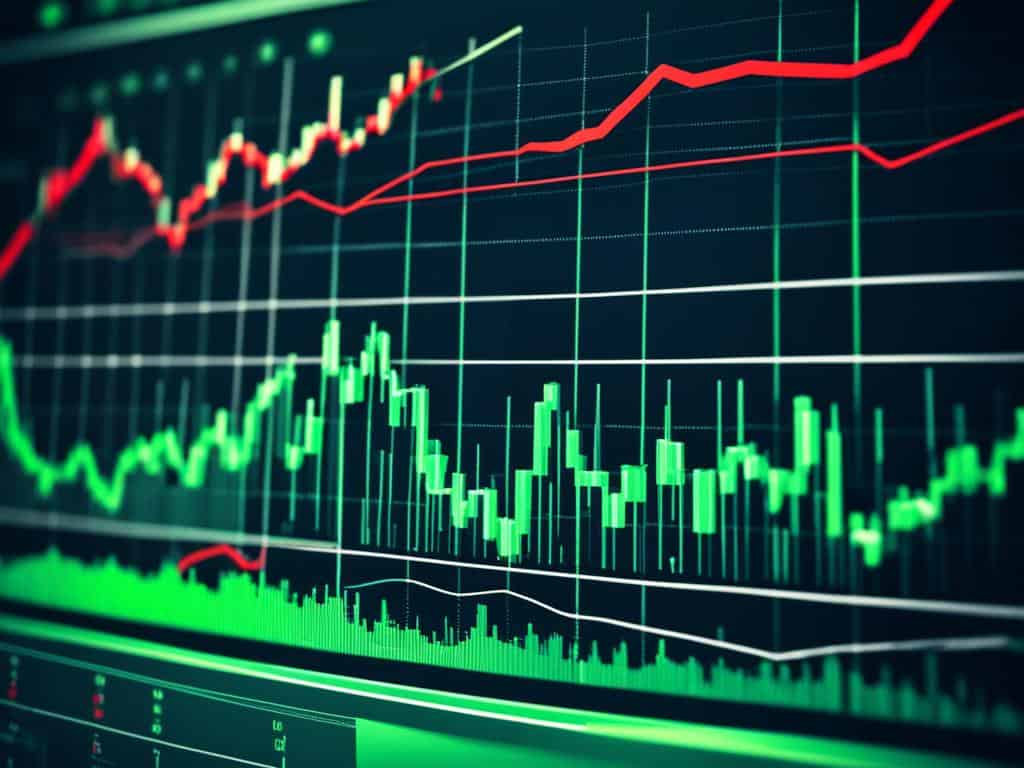
Despite its benefits, technical analysis has certain limitations. It heavily relies on price charts and historical data, which may not always accurately predict future price movements. Traders should be cautious about blindly following technical indicators and patterns without considering other factors. Technical analysis does not account for external events such as economic news or geopolitical developments that may have a significant impact on the market.
“Traders should be aware that technical analysis solely relies on price charts and historical data, which may not encompass all variables affecting market movements.”
It is important for traders to recognize the potential impact of external events on market dynamics and to incorporate fundamental analysis alongside technical analysis. By combining these two approaches, traders can gain a more comprehensive understanding of the market and make well-rounded trading decisions.
Key Concepts of Technical Analysis
Technical analysis incorporates several key concepts that traders utilize to make informed trading decisions. These concepts help traders understand market sentiment, identify potential price reversals, and spot emerging trends.
“Support and resistance levels are crucial elements in technical analysis. Support refers to the price level at which a market tends to find buying interest and prevents it from falling further. Resistance, on the other hand, is the price level at which a market faces selling pressure and struggles to break through. Traders pay close attention to these levels as they can indicate potential price reversals.”
Trends and ranges are additional key concepts in technical analysis. Markets can exhibit three primary trends: uptrend, downtrend, or trading within a range. An uptrend refers to a series of higher highs and higher lows, indicating bullish sentiment. Conversely, a downtrend consists of lower highs and lower lows, suggesting bearish sentiment. Ranges occur when a market consolidates between a defined support and resistance level.
To confirm trends and predict their potential continuation, traders employ indicators and patterns. Indicators are mathematical calculations based on price and volume data, while patterns represent specific price behaviors. By utilizing these tools, traders can gain insights into the future direction of a market.
Indicators
Indicators such as moving averages, relative strength index (RSI), and stochastic oscillator are commonly used in technical analysis. Moving averages assist in identifying trends by smoothing out price fluctuations, while the RSI helps determine overbuying and overselling conditions. The stochastic oscillator focuses on the current price in relation to its price range over a specific period, aiding in identifying potential reversal points.
By understanding these key concepts and applying them effectively, traders can enhance their technical analysis skills and make more informed trading decisions.
The Importance of Patterns in Technical Analysis
Patterns are a critical aspect of technical analysis as they represent specific price behaviors and provide insights into future price movements. By studying chart patterns, traders can identify potential trend reversals or continuations, allowing them to make informed trading decisions.
Some common chart patterns used in technical analysis include:
- Head and shoulders: This pattern consists of a peak (the head) with two smaller peaks (the shoulders) on either side. It indicates a potential trend reversal from bullish to bearish.
- Double top: This pattern occurs when the price reaches a high point, retraces, and then fails to break through the previous high, suggesting a bearish reversal.
- Flags and pennants: These patterns represent consolidation periods within an existing trend. Flags are rectangular patterns, while pennants resemble symmetrical triangles. They indicate that the price is likely to continue in the same direction after the consolidation.
Chart patterns serve as visual representations of market psychology and can be powerful indicators for traders. They enable the detection of potential shifts in supply and demand dynamics and provide valuable entry and exit signals.
In addition to chart patterns, traders also use various technical indicators to enhance their analysis:
- Moving averages: These indicators smooth out price data and help identify trends by calculating the average price over a specific period. Traders look for crossovers between different moving averages to spot potential entry or exit points.
- Bollinger Bands: These indicators consist of a middle band (usually a moving average) and upper and lower bands that represent standard deviations from the average. They help traders determine the price’s volatility and potential reversal points.
- Relative Strength Index (RSI): This indicator measures the strength and speed of a price movement and identifies overbought or oversold conditions. It is widely used to confirm potential trend reversals.
By utilizing both chart patterns and technical indicators, traders can gain a more comprehensive understanding of market trends and price movements. This combination of analysis techniques can aid in making more accurate predictions and improving overall trading performance.
Using Indicators in Technical Analysis
When it comes to technical analysis, traders rely on a variety of indicators to help them make well-informed trading decisions. These indicators are mathematical calculations based on price and volume data, providing valuable insights into market trends and conditions. In this section, we will explore some popular indicators used in technical analysis.
Moving Averages
One commonly used indicator is the moving average. It helps traders identify trends by calculating the average price over a specified period. By plotting moving averages on a chart, traders can identify potential entry or exit points when the moving averages cross over. This indicator is widely used and helps traders gauge the overall direction of a trend.
Relative Strength Index (RSI)
The Relative Strength Index (RSI) is another popular indicator in technical analysis. It helps traders identify overbuying and overselling conditions in the market. The RSI compares the magnitude of recent gains to recent losses, indicating whether an asset is undervalued or overvalued. By monitoring the RSI, traders can identify potential reversal points and make informed trading decisions.
Stochastic Oscillator
The stochastic oscillator is a momentum indicator that compares the current price of an asset to its price range over a specific period. It helps traders identify potential overbought or oversold conditions in the market. The stochastic oscillator consists of two lines: the %K line and the %D line. By analyzing the movements of these lines, traders can determine when an asset is due for a reversal or continuation in its price trend.
To effectively analyze price data and identify trends, traders frequently use a combination of indicators tailored to their trading strategies. These indicators, including moving averages, RSI, and stochastic oscillator, help traders make better-informed decisions and capitalize on overbuying and overselling conditions in the market.
Conclusion
Technical analysis is a vital skill for forex traders, as it plays a key role in refining trading strategies, identifying market trends, and making informed investment decisions. By studying chart patterns, utilizing key indicators, and considering both technical and fundamental analysis, traders can enhance their technical analysis skills and improve their chances of success in the forex market.
While technical analysis has its drawbacks and limitations, such as reliance on price charts and the potential impact of external events, it remains a valuable tool when combined with risk management, discipline, and emotional control. Traders who master technical analysis can gain a deeper understanding of market dynamics and effectively navigate price fluctuations.
Successful trading requires the ability to adapt to changing market conditions. By combining technical analysis with fundamental analysis, traders can gain a more comprehensive view of the forex market. Fundamental analysis provides insights into economic data, earnings reports, and other factors that can influence currency movements. When used together, technical and fundamental analysis create a well-rounded approach to trading, allowing traders to make more informed decisions based on a broader range of information.
In conclusion, mastering technical analysis is crucial for successful forex trading. Traders who dedicate time and effort to studying chart patterns, utilizing key indicators, and combining technical and fundamental analysis will be better equipped to navigate the complexities of the forex market. With practice and expertise, traders can refine their trading strategies, identify market trends, and ultimately increase their chances of achieving success in forex trading.
FAQ
What is technical analysis?
Technical analysis is a method used by traders to identify trading opportunities by reading price charts and determining the future direction of a market and potential entry and exit points.
What is the difference between technical analysis and fundamental analysis?
While technical analysis focuses solely on price charts and patterns, fundamental analysis takes into account factors such as earnings and economic data.
Can I use technical analysis and fundamental analysis together?
Yes, traders can use either approach independently or in combination to make informed investment decisions.
What are the benefits of technical analysis?
One of the main benefits of technical analysis is that it is considered a neutral trading tool. It can be applied to any instrument and timeframe and doesn’t rely on an analyst’s forecast.
What are the drawbacks of technical analysis?
Technical analysis solely relies on price charts and historical data, which may not always accurately predict future price movements. It also doesn’t take into account external factors like economic events that can impact the market.
What are some key concepts in technical analysis?
Some key concepts in technical analysis include support and resistance levels, trends and ranges, and the use of indicators and patterns.
How do patterns play a role in technical analysis?
Patterns represent specific price behaviors and can indicate future price movements. Traders use chart patterns such as head and shoulders, double top, flags, and pennants to identify potential trend reversals or continuations.
What are some common indicators used in technical analysis?
Some common indicators used in technical analysis include moving averages, Bollinger Bands, and the Relative Strength Index (RSI).
How can technical analysis help in forex trading?
Technical analysis helps forex traders refine their trading strategies, identify market trends, and make informed investment decisions.
Can technical analysis guarantee success in forex trading?
While technical analysis is an important skill, it should be combined with risk management, discipline, and the ability to control emotions for successful trading.
Source Links
- https://ospreyfx.com/education/guide-to-understanding-and-mastering-technical-analysis/
- https://tradingstrategyguides.com/key-indicators-forex/
- https://www.forex.com/en/trading-academy/courses/technical-analysis/understanding-technical-analysis/
